Convert Meal Plan Images with Python, OpenCV, and Tesseract
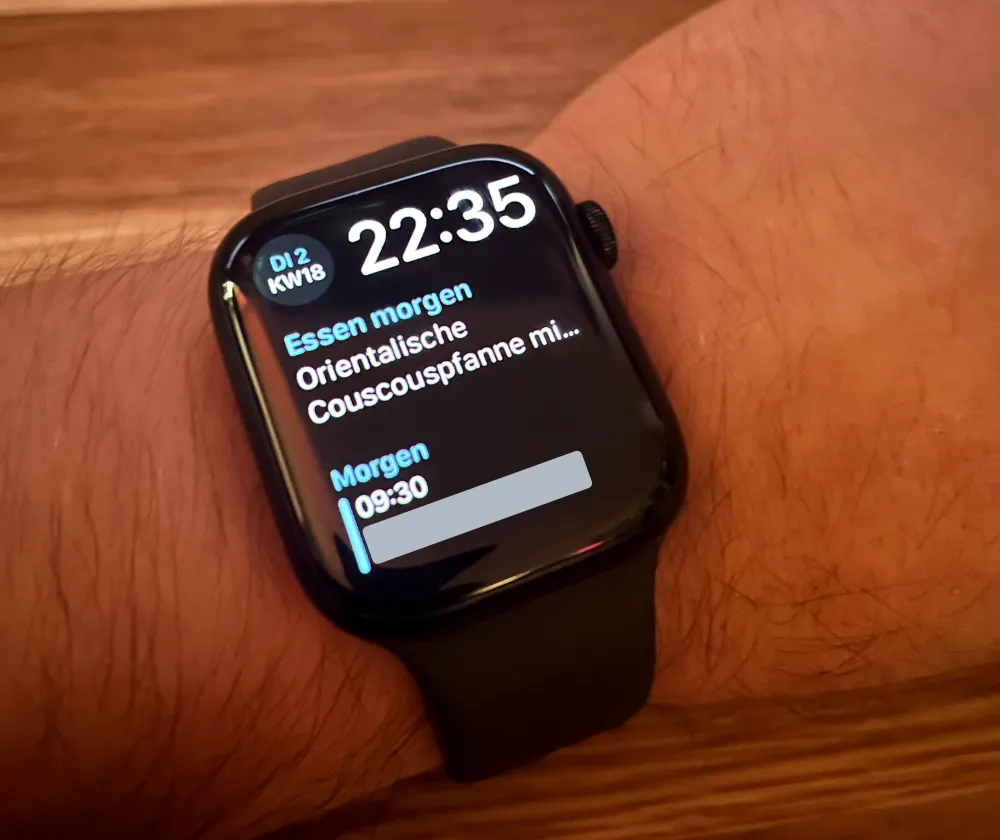
My vision was to have the meal of the day on my Apple Watch, but the meal plan is only available as a picture and not as structured data.
Starting point
Each week, an image of the meal plan gets posted on a Confluence1 page. I download them with a python script, so that I can process it using OCR.
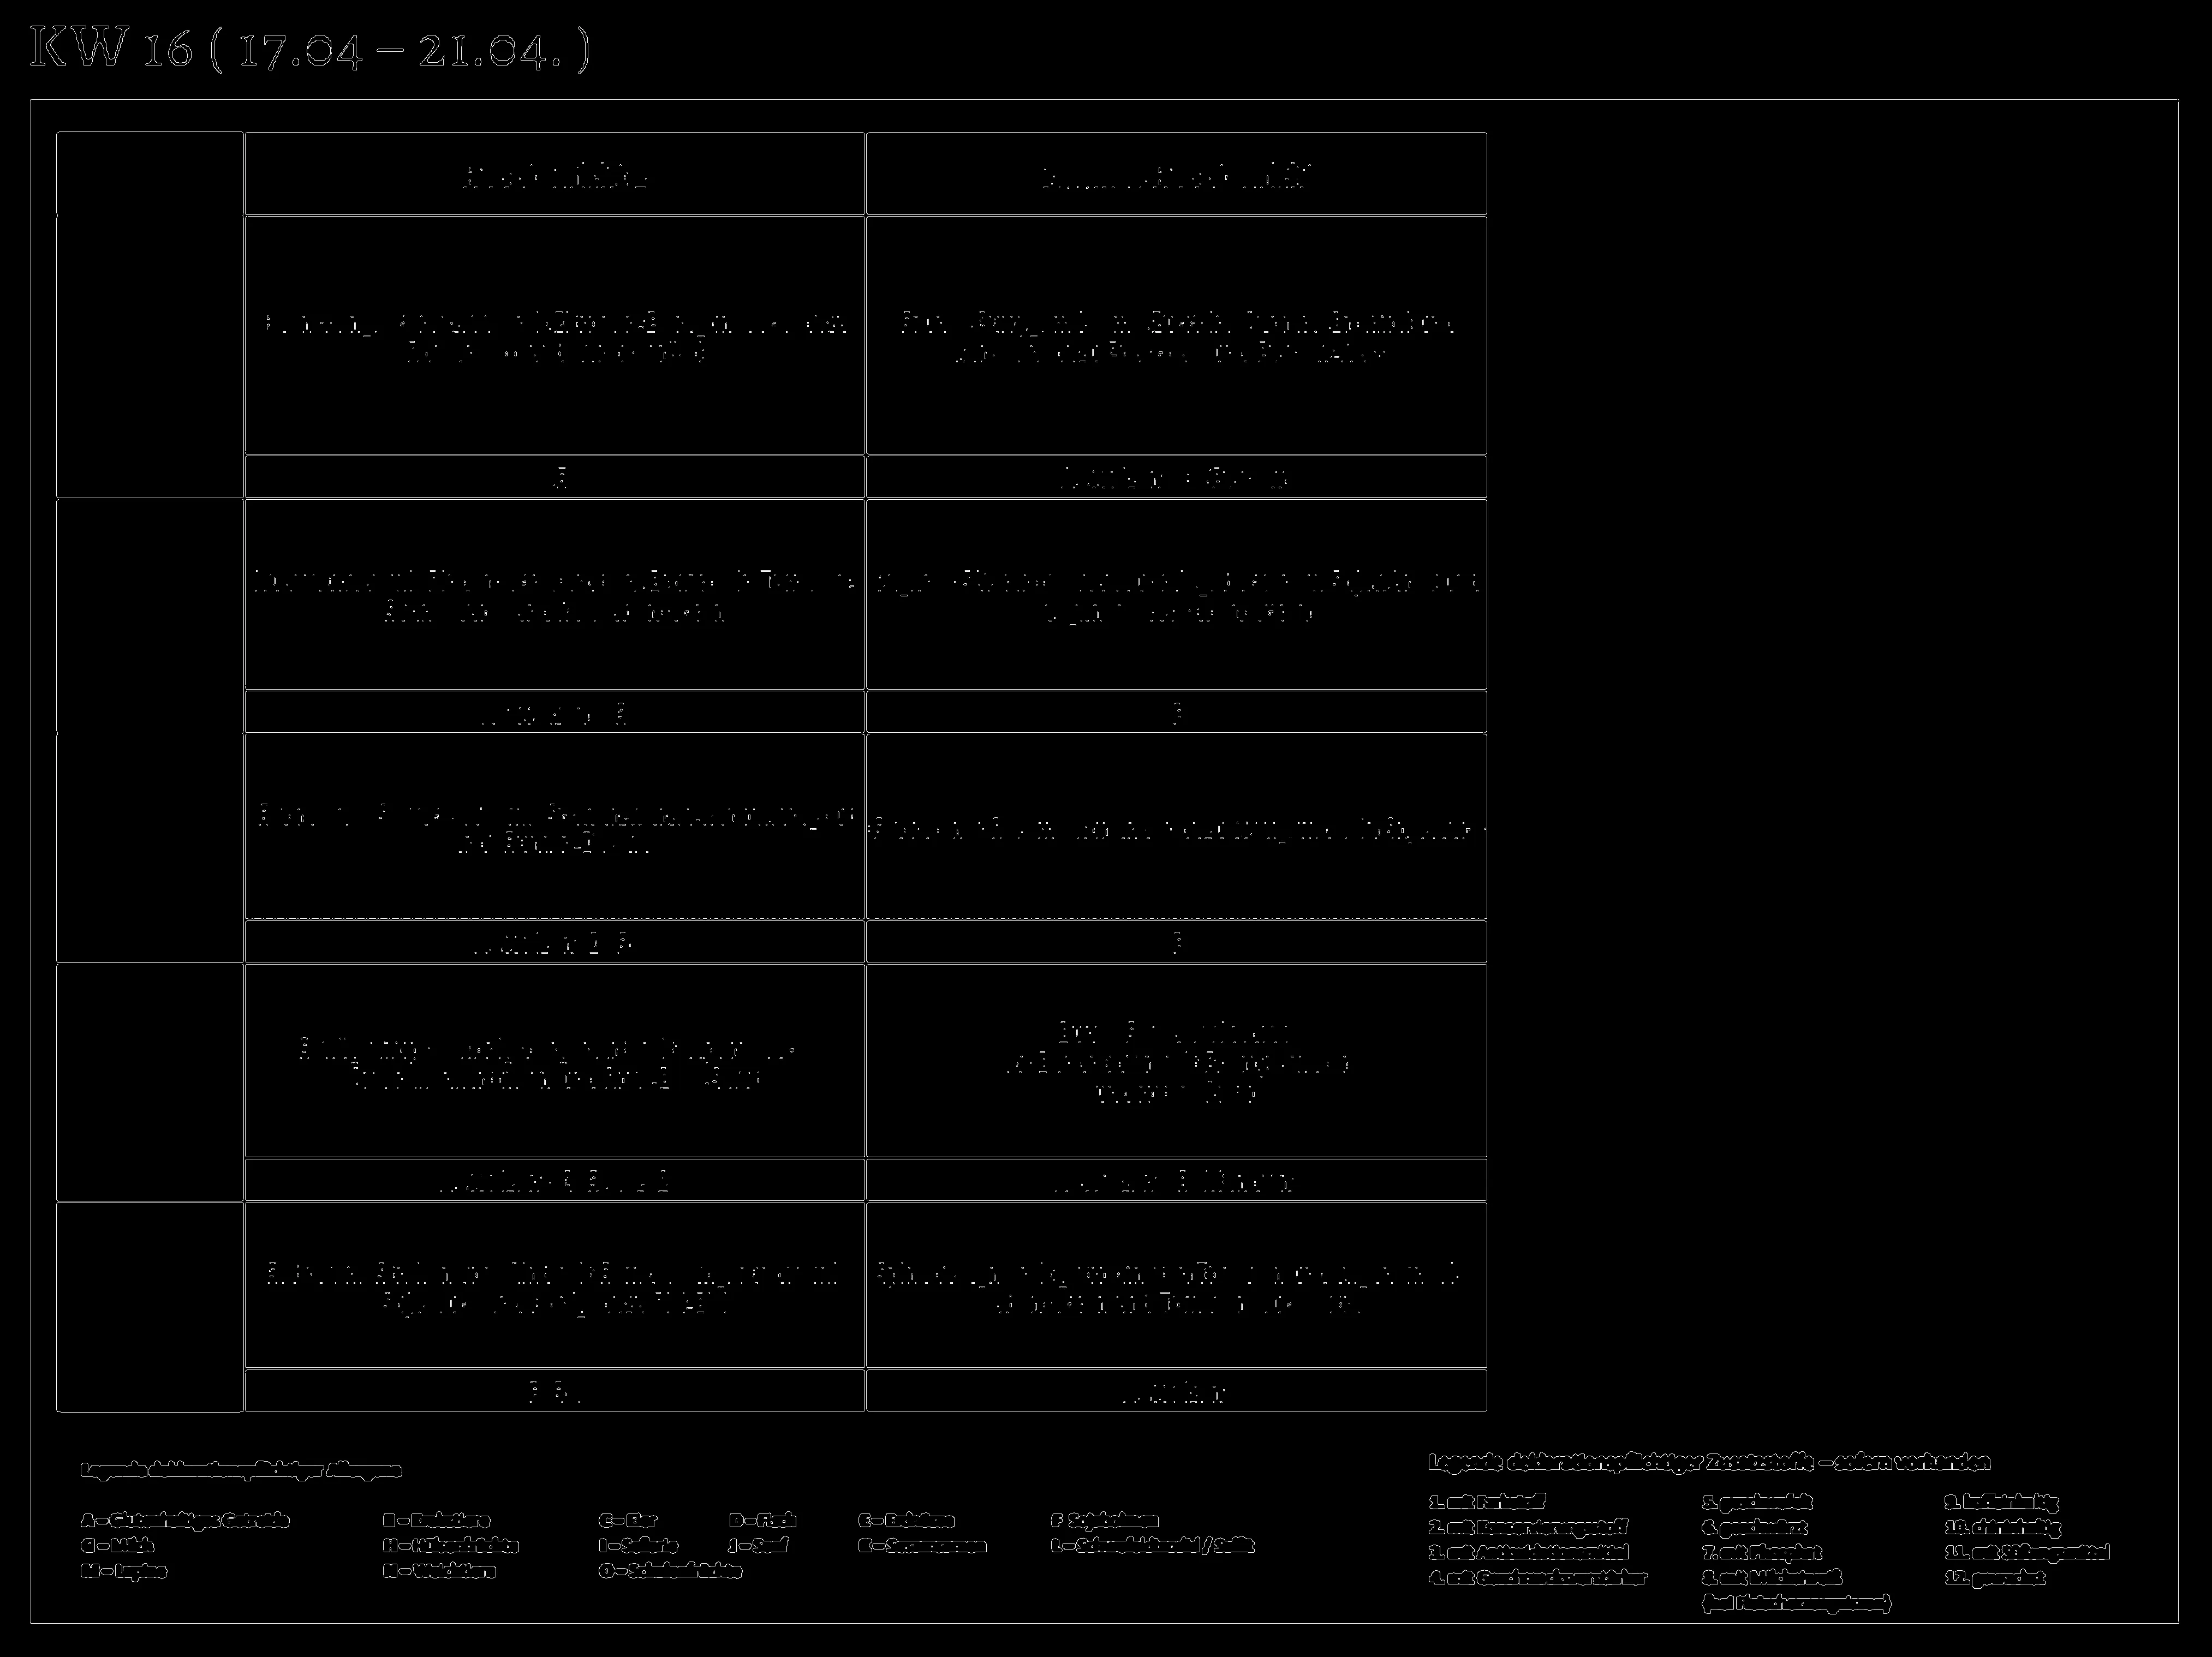
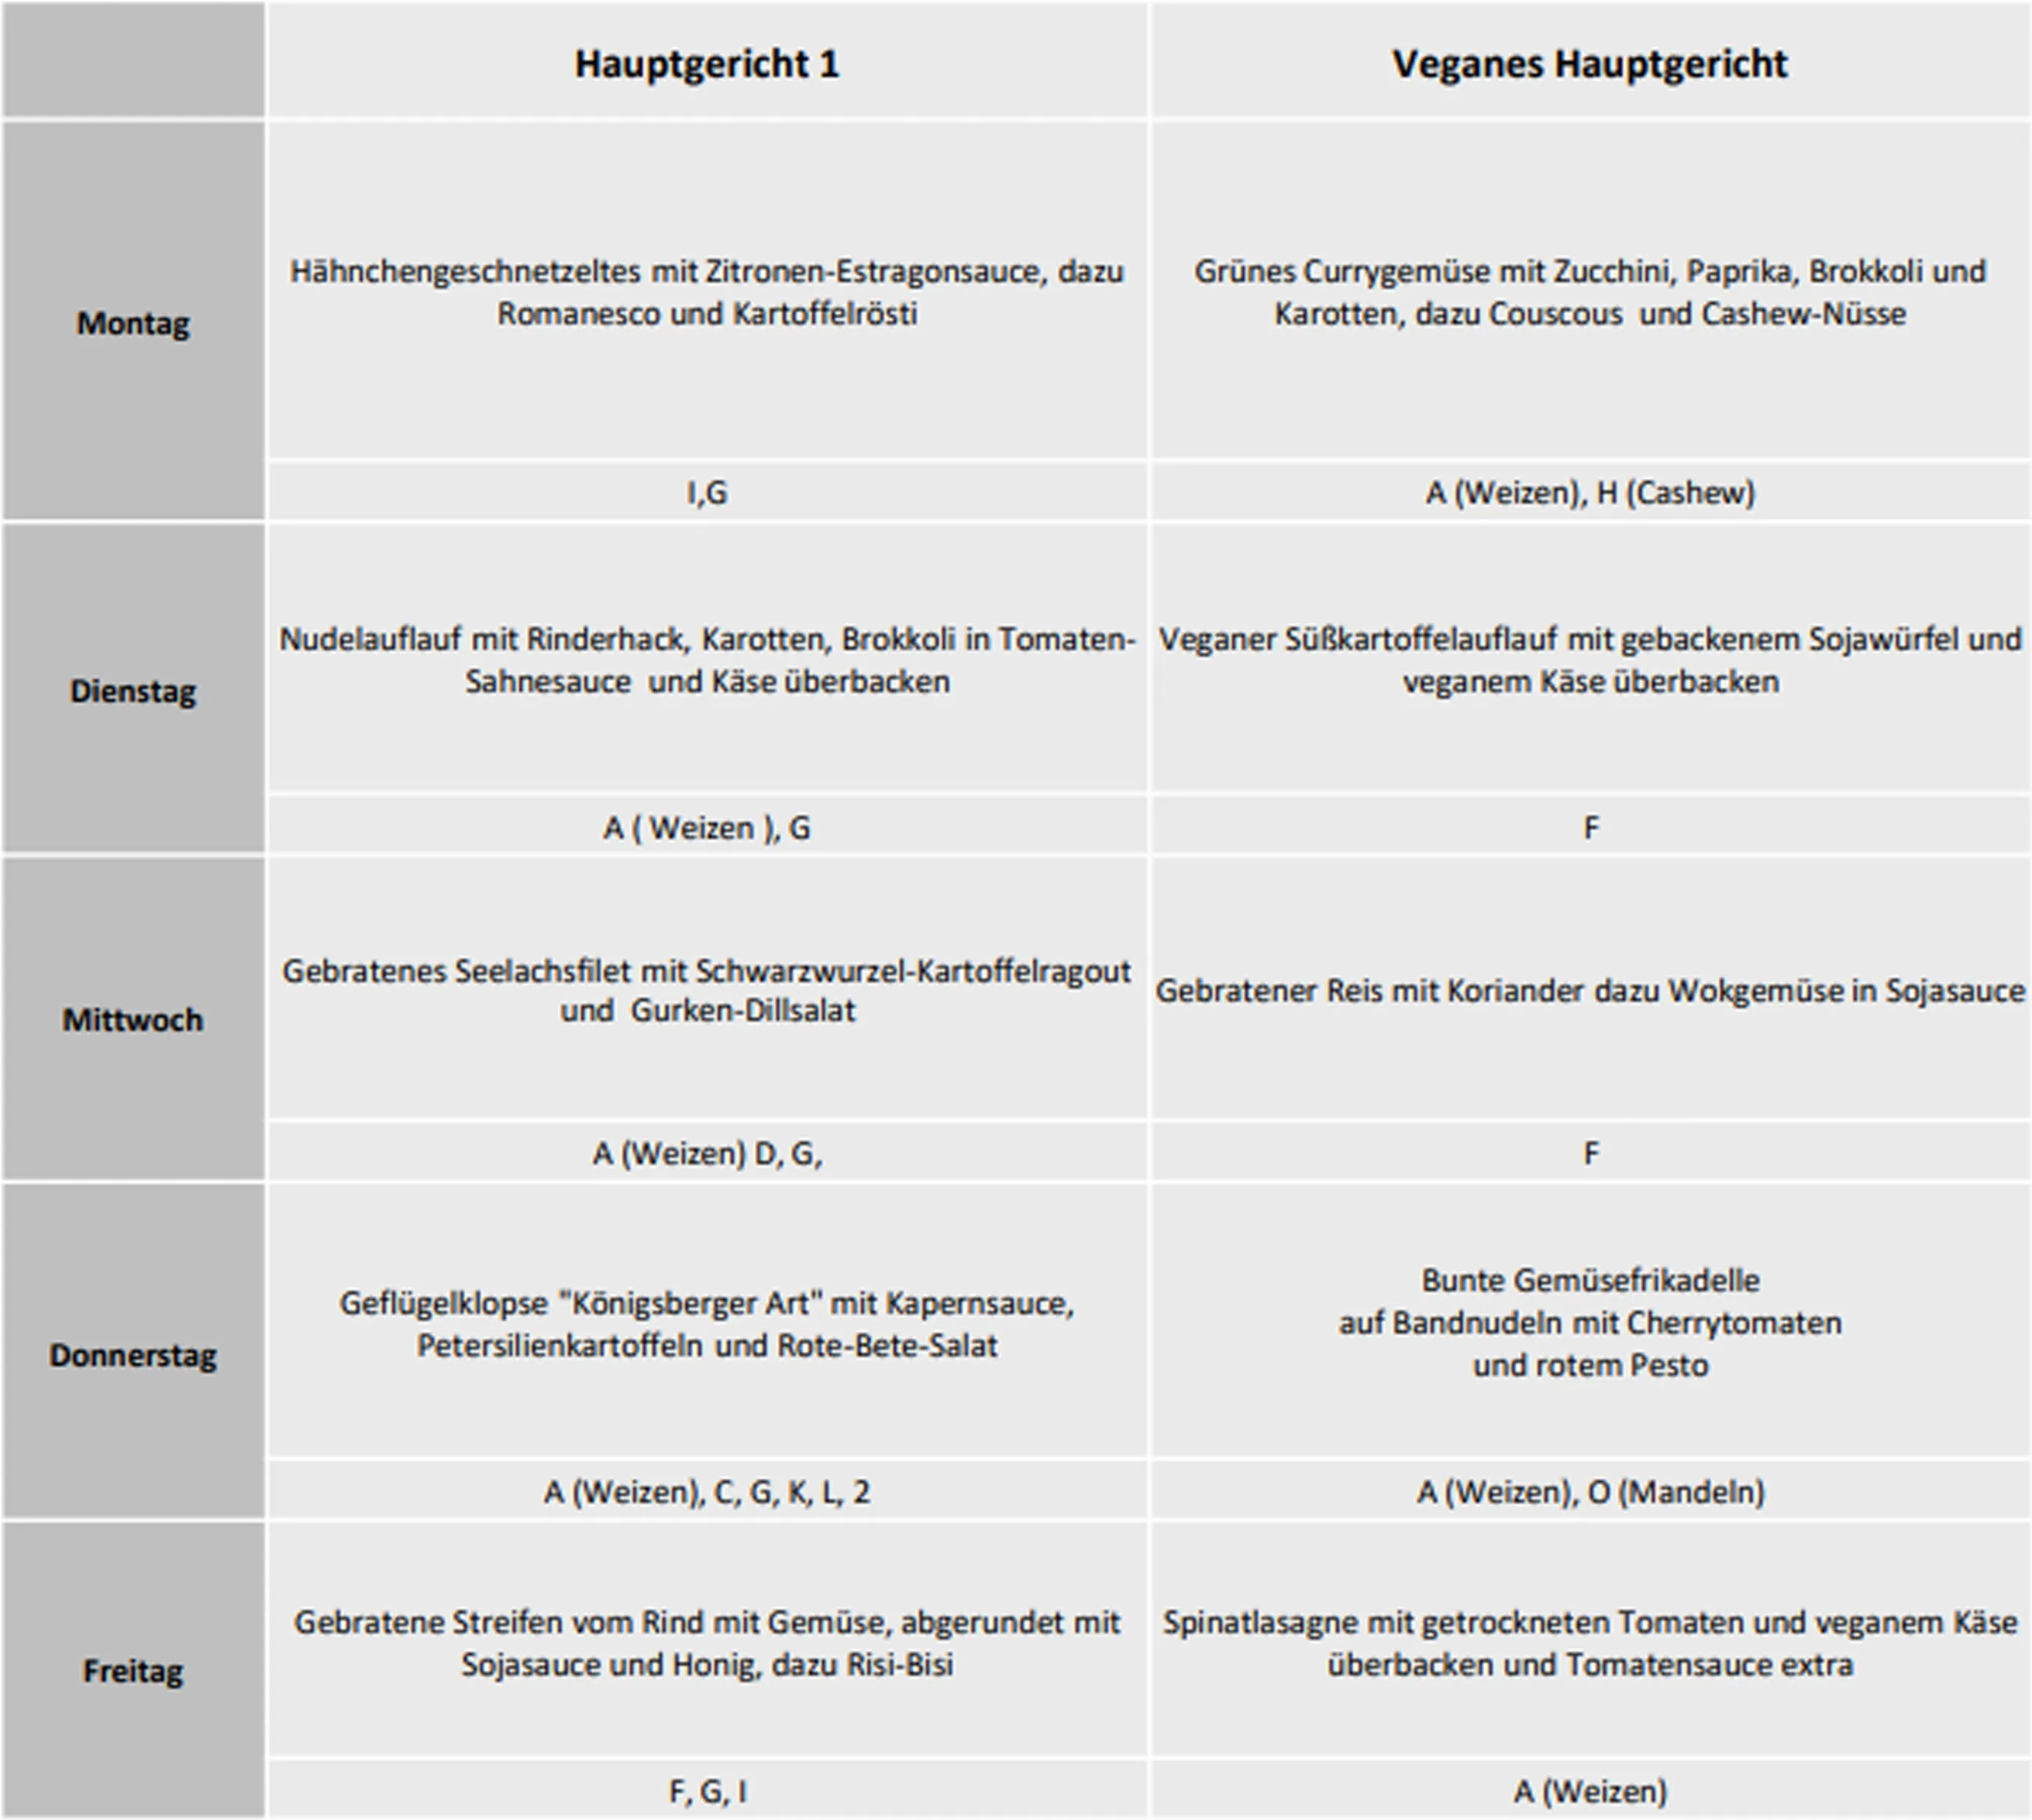
Images of the meal plan look like this (including the strange white borders!):
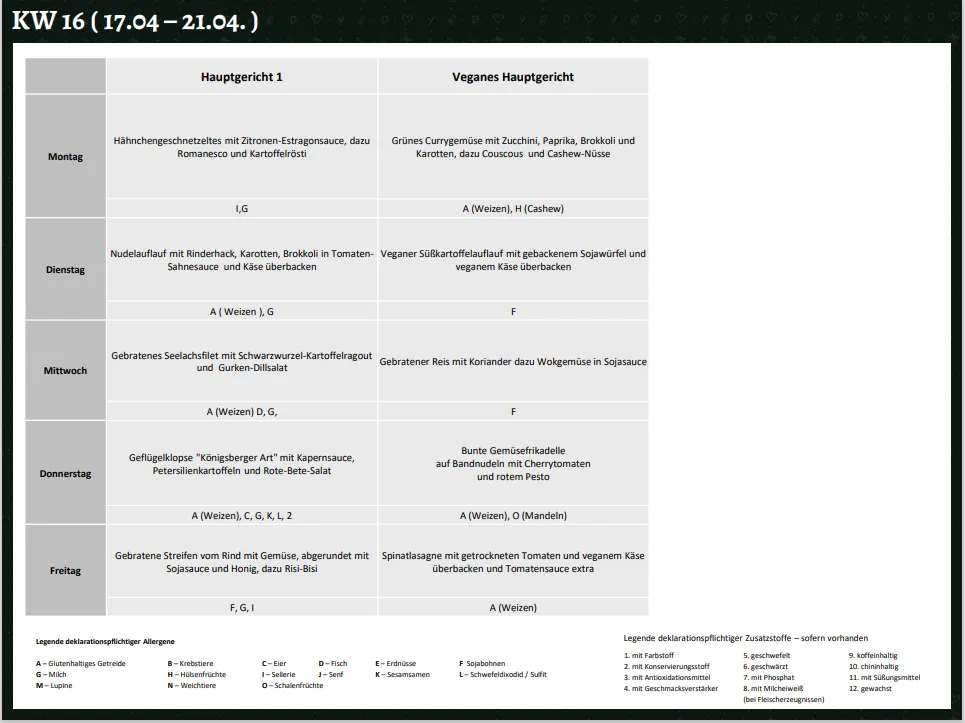
Each week the image is slightly different:
- sometimes it has white borders, sometimes it doesn’t
- the resolution is slightly different
- the font is not always the same
- rows and columns are not always the same size, rather determined by the text within
Glossary
I’ll use the following terms throughout the article:
- OCR: Optical Character Recognition, the process of converting images of text to text
- Tesseract: A popular open-source OCR engine
- OpenCV: Open Source Computer Vision Library, a library for image processing
- Python: A programming language
Preprocessing
To account for the image variances, we need to do some preprocessing.
- upscale the image
- find contours
- find rects
- use biggest rect as new smallest area
We can do that with this script:
# upscale, the factor upscales the image to ~300 dpi
scale = 4.2
scaled = cv2.resize(img, None, fx=scale, fy=scale,
                    interpolation=cv2.INTER_CUBIC)

# convert image to grayscale
grayscale = cv2.cvtColor(scaled, cv2.COLOR_BGR2GRAY)

# convert to binary
(_, tableCellContrast) = cv2.threshold(
    ~grayscale, 5, 255, cv2.THRESH_BINARY)

# find edges
edges = cv2.Canny(tableCellContrast, 5, 10)
The edges image looks like this:
We can use the biggest rectangle as the bounds to crop the image:
contours, _ = cv2.findContours(
    edges, cv2.RETR_TREE, cv2.CHAIN_APPROX_SIMPLE
)[-2:]

biggest_contour = None
max_area = 0

for contour in contours:
    area = cv2.contourArea(contour)
    if area > max_area:
        max_area = area
        biggest_contour = contour

x, y, w, h = cv2.boundingRect(biggest_contour)
cropped = scaled[y:y+h, x:x+w]
After these steps, the result is this:
Extracting cells
Using the same tricks as above, we can use contours and lines to find the cells in the table. I created a visualization to show you the bounds of the cells the algorithm found:
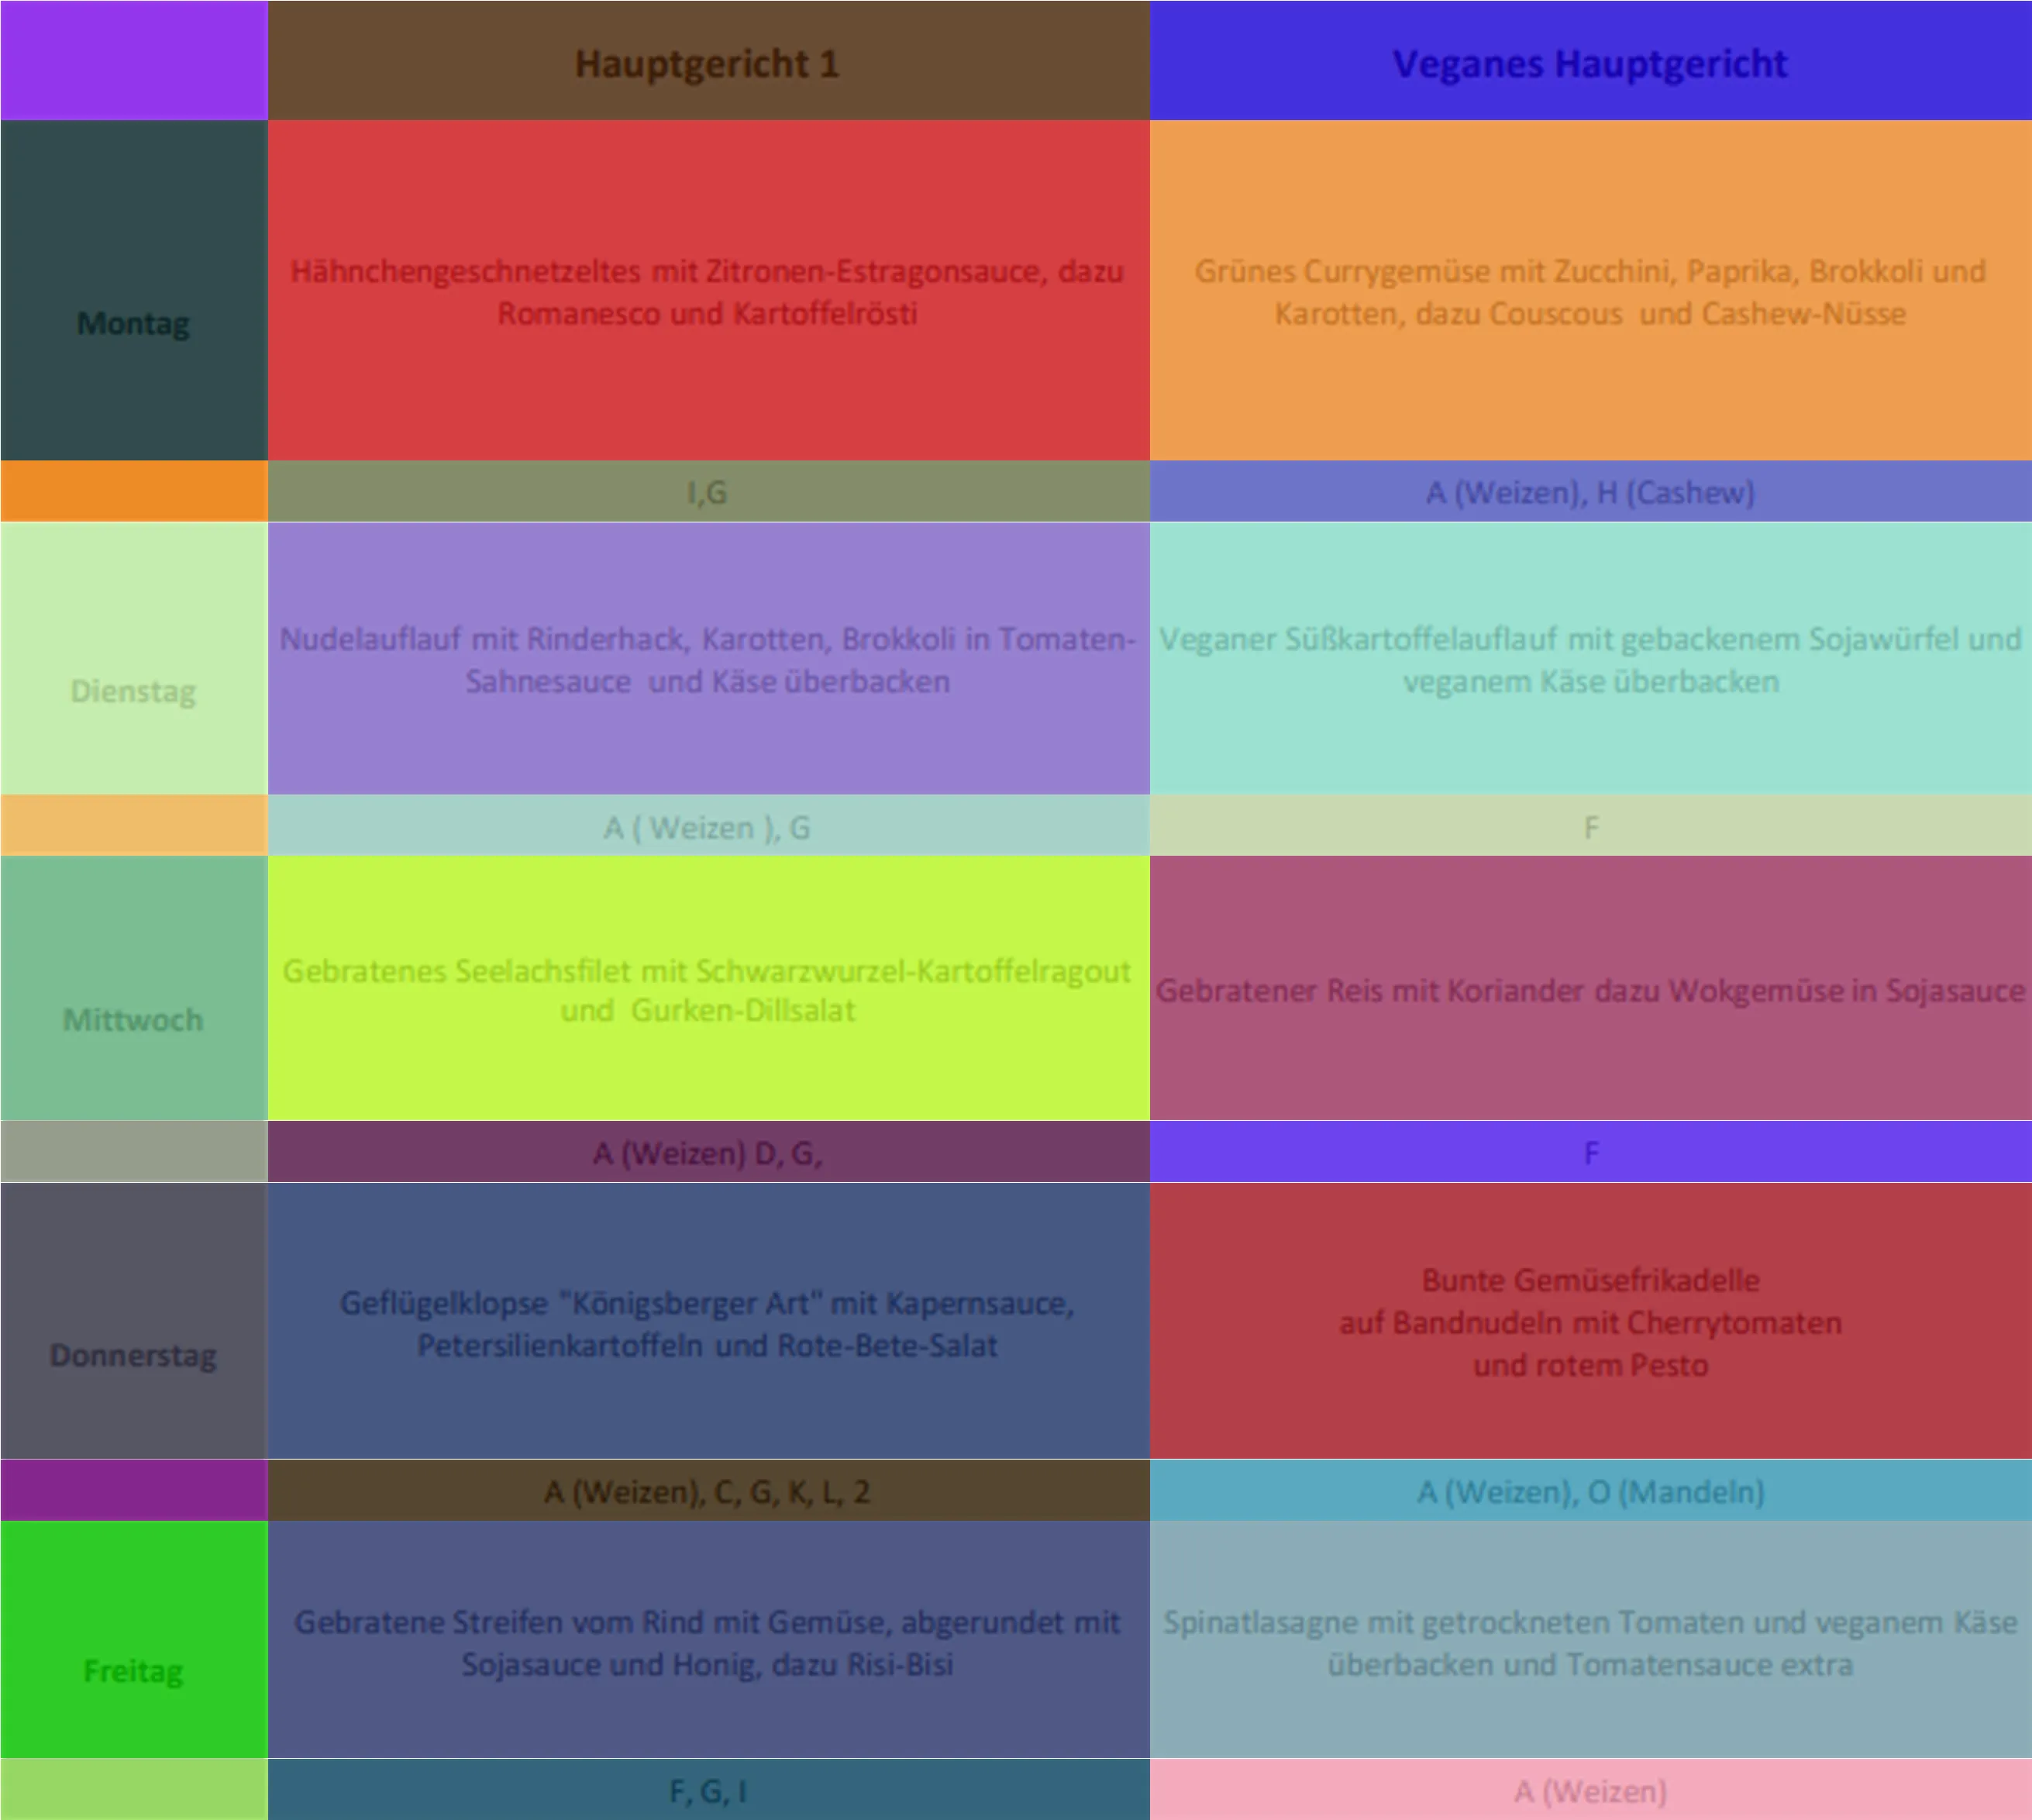
The code for this one is a little bit longer, and contains some quirks to get the cells reliably. If you still want to see it, you can expand the next section:
Code block: Extracting cells
grayscale = cv2.cvtColor(img, cv2.COLOR_BGR2GRAY)
(_, tableCellContrast) = cv2.threshold(
  ~grayscale, 5, 255, cv2.THRESH_BINARY)

# start lines
imgLines = cv2.cvtColor(np.zeros_like(
  tableCellContrast), cv2.COLOR_GRAY2RGB)

imgwidth, imgheight = img.shape[1], img.shape[0]
minLineLength = imgwidth // 10
lines = cv2.HoughLinesP(
  image=~tableCellContrast,
  rho=0.02,
  theta=np.pi / 500,
  threshold=10,
  lines=np.array([]),
  minLineLength=minLineLength,
  maxLineGap=10,
)

a, _, _ = lines.shape
for i in range(a):
  if abs(lines[i][0][0] - lines[i][0][2]) > abs(lines[i][0][1] - lines[i][0][3]):
      # horizontal line
      cv2.line(
          imgLines,
          (0, lines[i][0][1]),
          (imgwidth, lines[i][0][3]),
          (0, 0, 255),
          1,
          cv2.LINE_AA,
      )
  else:
      # vertical line
      cv2.line(
          imgLines,
          (lines[i][0][0], 0),
          (lines[i][0][2], imgheight),
          (0, 0, 255),
          1,
          cv2.LINE_AA,
      )

cv2.rectangle(imgLines, (0, 0), (imgwidth, imgheight), (0, 255, 0), 2)
(thresh, table) = cv2.threshold(
  cv2.cvtColor(imgLines, cv2.COLOR_BGR2GRAY),
  128,
  255,
  cv2.THRESH_BINARY | cv2.THRESH_OTSU,
)
# end lines

# start contours
img_boxes = cv2.cvtColor(grayscale, cv2.COLOR_GRAY2RGB)

# create new cv image with same dimensions as cropped image
contours, hierarchy = cv2.findContours(
  table, cv2.RETR_CCOMP, cv2.CHAIN_APPROX_SIMPLE
)[-2:]
idx = 0

cells = []

for cnt in contours:
  idx += 1
  x, y, w, h = cv2.boundingRect(cnt)
  area = w * h

  if w > imgwidth * 0.9 or h > imgheight * 0.9 or w < 10 or h < 10:
      continue

  roi = grayscale[y: y + h, x: x + w]

  cells.append(Cell(roi, x, y, w, h, None))

  color = list(np.random.random(size=3) * 256)
  cv2.rectangle(img_boxes, (x, y), (x + w, y + h),
                  color, thickness=FILLED)

# end contours
cols = list(sorted(set([cell.x for cell in cells])))
rows = list(sorted(set([cell.y for cell in cells])))

for cell in cells:
  x, y, w, h = cell.x, cell.y, cell.w, cell.h

  cell.y = rows.index(y)
  cell.x = cols.index(x)
Cell is a small dataclass that looks like this:
from dataclasses import dataclass
import numpy as np

@dataclass
class Cell:
    image: np.ndarray
    x: int
    y: int
    w: int
    h: int
    text: str
Preparing for OCR
OCR works best on high-contrast images that might look strange to humans but are easy to work with by computers.
To create this image, we’ll use dilation and erosion2 to remove artifacts from the letters:
grayscale = cv2.cvtColor(img, cv2.COLOR_BGR2GRAY)
img = grayscale
kernel = np.ones((1, 1), np.uint8)
img = cv2.dilate(img, kernel, iterations=1)
img = cv2.erode(img, kernel, iterations=1)
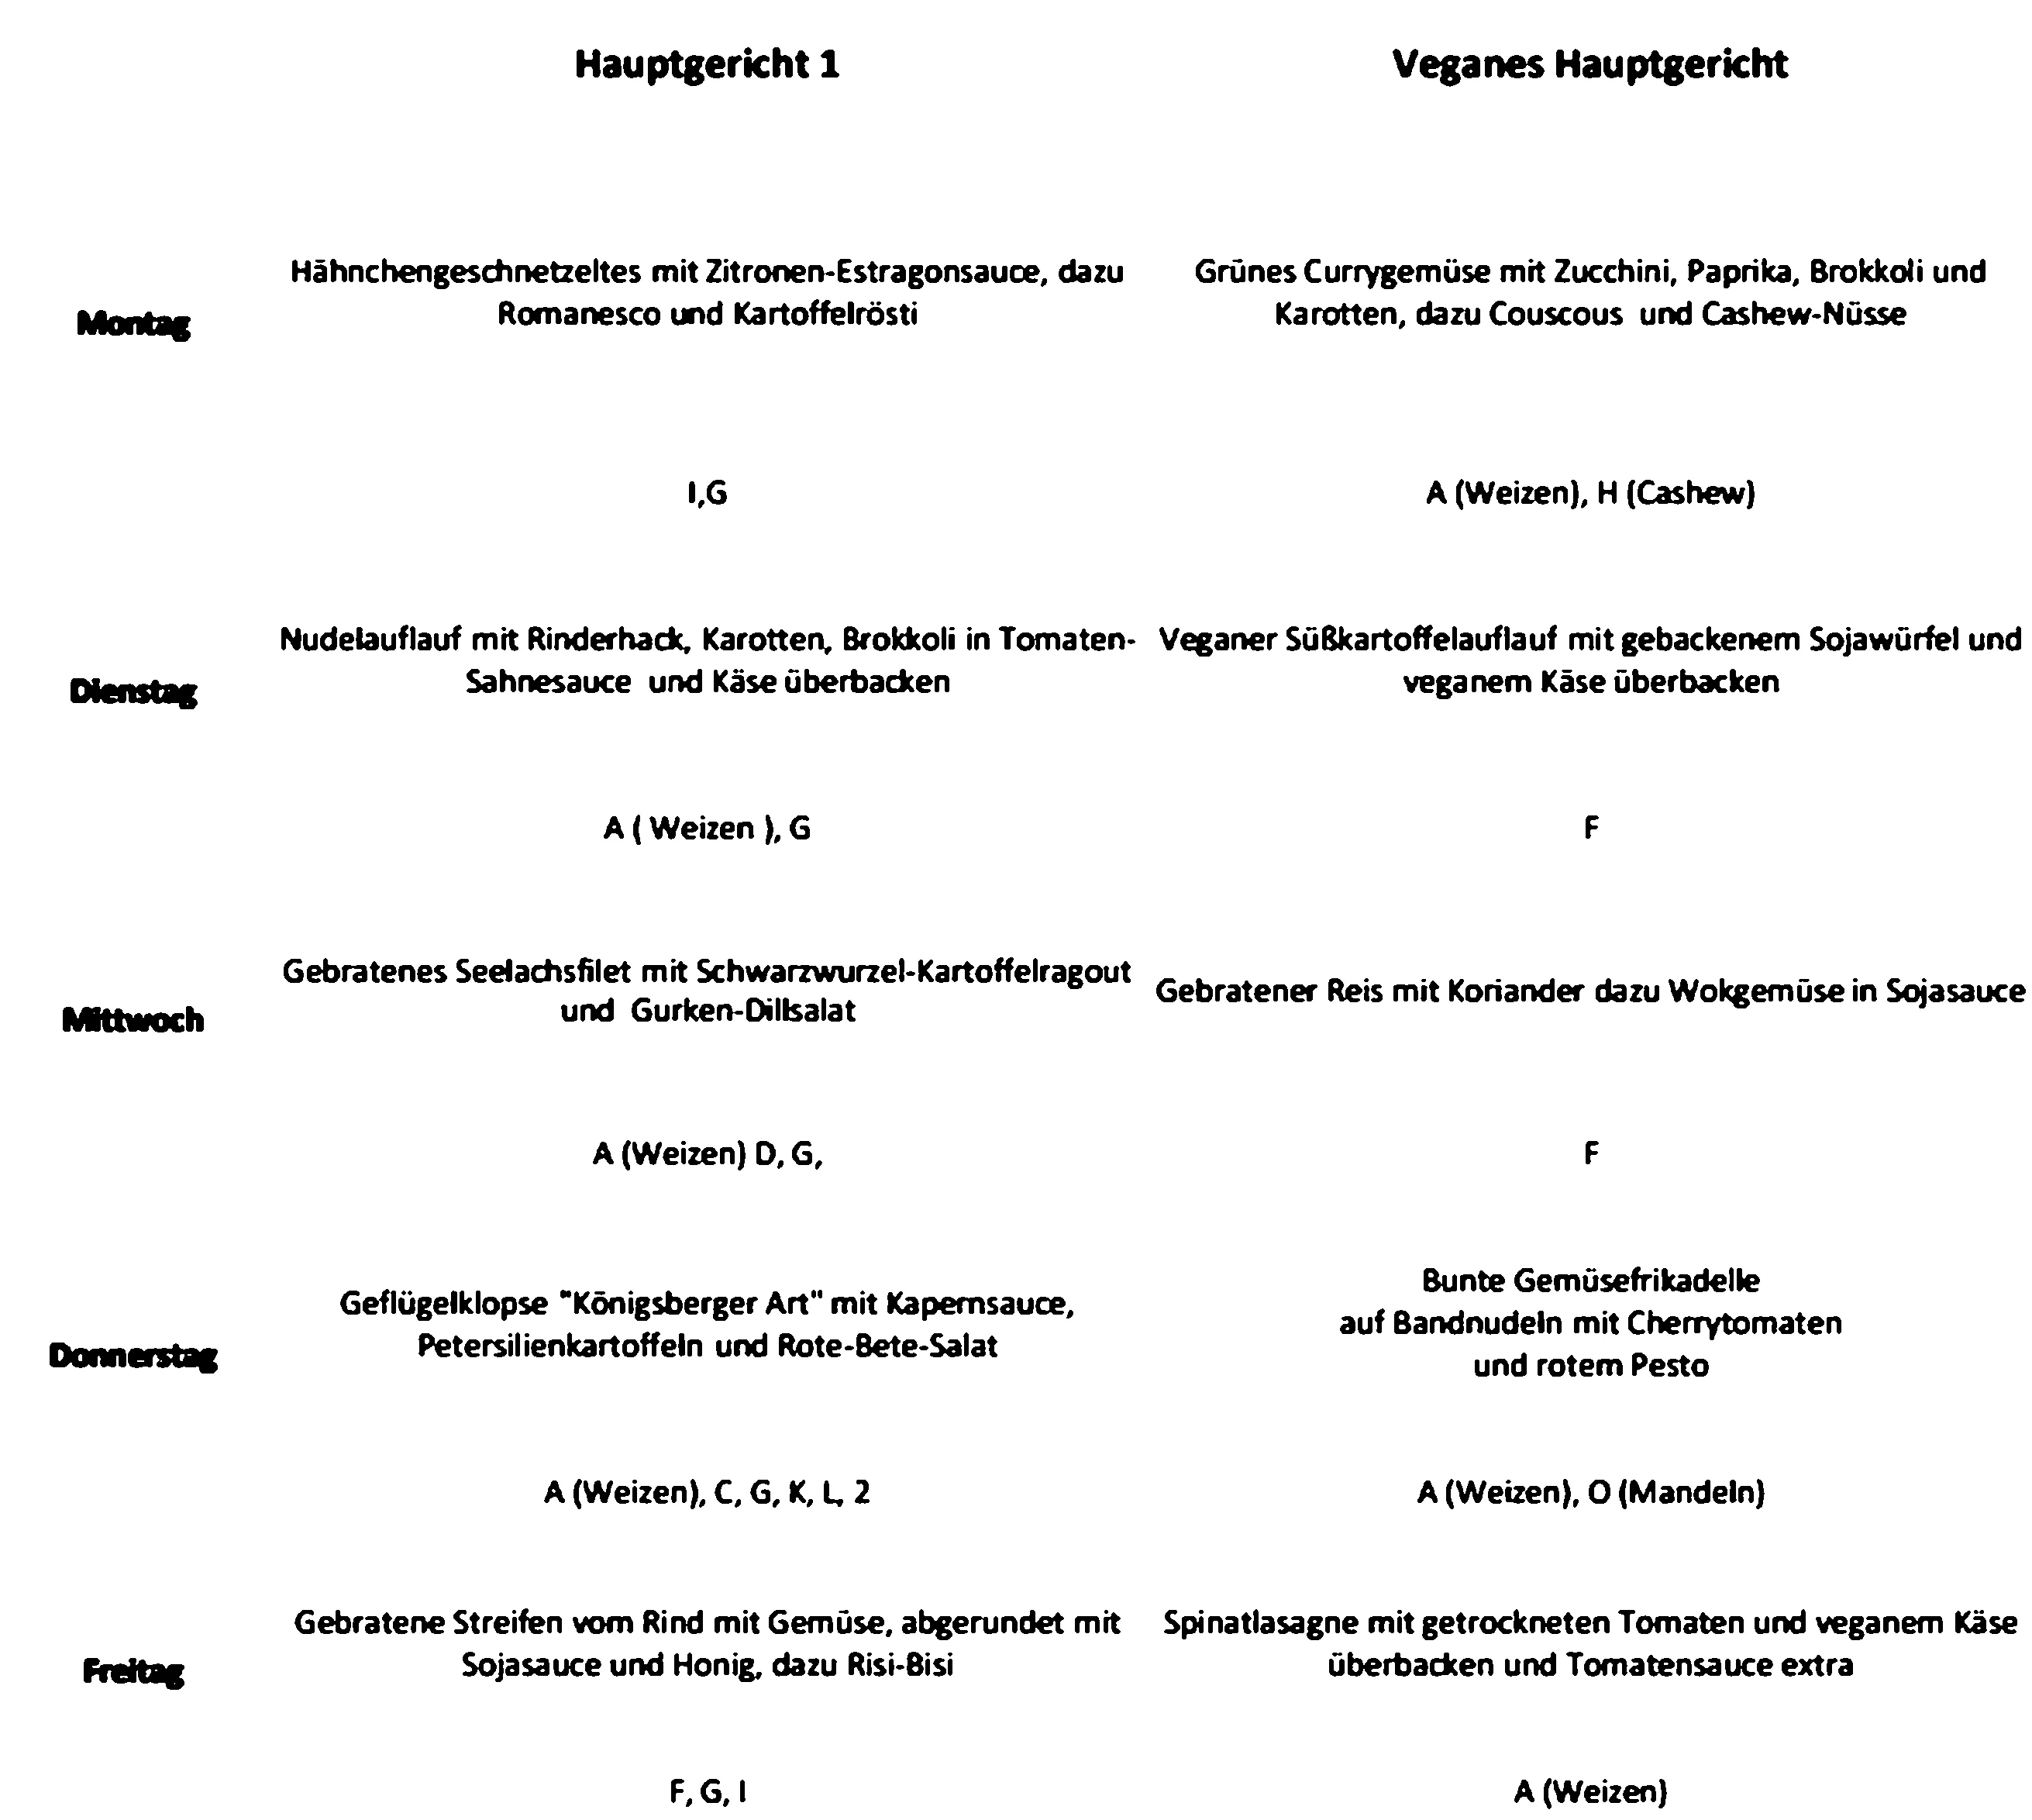
img = cv2.threshold(cv2.medianBlur(img, 3), 0, 255,
cv2.THRESH_BINARY + cv2.THRESH_OTSU)[1]This is what the image looks like now:
OCR and data transformation
Now we have an image to work with. We already have the cell information, so we can run ocr on each cell instead of the whole image to know exactly which part of the image contains what data. Otherwise, it would be extremely painful to assign the ocr data to the information we need.
custom_config = r"--oem 1 --psm 11 -l deu -c tessedit_write_images=true "

for cell in cells:
  if not cell.text or forceExtract:
      text = pytesseract.image_to_string(
          cell.image, config=custom_config, lang="frak"
      )

      # remove line breaks and form feed chars
      cell.text = text.replace("\n", " ").replace("\f", "").strip()

# sort cells by their coordinates
cells.sort(key=lambda cell: (cell.y, cell.x))
With the cells in the right order, we can transform the data to a dictionary:
table = {}

germanWeekdayToEnglish = {
    "Montag": 0,
    "Dienstag": 1,
    "Mittwoch": 2,
    "Donnerstag": 3,
    "Freitag": 4,
    "Samstag": 5,
    "Sonntag": 6,
}

for cell in [c for c in cells if c.x == 0]:
    table[cell.y] = [c.text for c in cells if c.y == cell.y]

categories = list(table[0])[1:]

days = {}
for y in range(1, len(table), 2):
    weekday = germanWeekdayToEnglish[table[y][0]]

    meals = [
        {
            "category": trim(categories[i]),
            "meal": trim(meal),
            "ingredients": [trim(x) for x in table[y + 1][i + 1].split(",")],
        }
        for i, meal in enumerate(table[y][1:])
    ]

    days[weekday] = meals
The json file for each weekday looks like this:
[
  {
    "category": "Hauptgericht 1",
    "meal": "Gebratene Streifen vom Rind mit Gemüse, abgerundet mit Sojasauce und Honig, dazu Risi-Bisi",
    "ingredients": ["F", "G", "I"]
  },
  {
    "category": "Veganes Hauptgericht",
    "meal": "Spinatlasagne mit getrockneten Tomaten und veganem Käse überbacken und Tomatensauce extra",
    "ingredients": ["A (Weizen)"]
  }
]
REST API
My REST API is extremely simple. I just copy over the jsons to a webserver that hosts these jsons as static files.
Usage works like this: Do a GET-Request for a date like this: GET /2022-05-03.json
Using the data
I’m using the API to show the current meal on my Apple Watch. After 1 p.m., it shows the meal for the next day.
Footnotes
-
Confluence is a wiki software like Wikipedia, but for your company. ↩
-
See docs.opencv.org. ↩